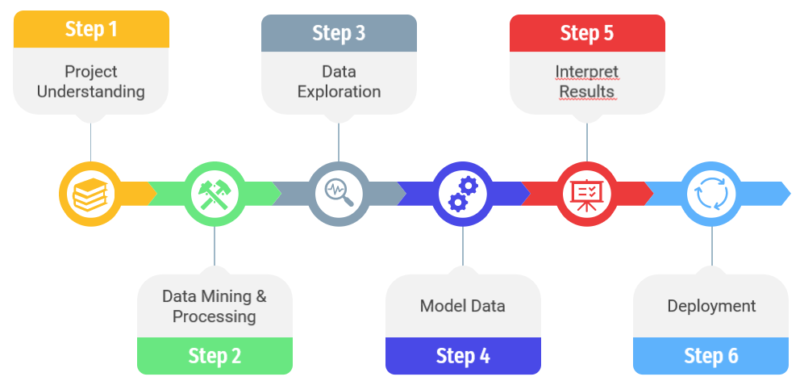
To be completed in a qualitative way, a data science project must follow a certain methodology composed of 6 different steps.
Step 1 : Project understanding
In this step we’re looking to fully grasp the scope of the project and typically determine the following:
-
-
- The problem
- The potential solution(s)
- The necessary tools & techniques
-
For this purpose, several questions could be asked:
-
-
- What is the objective of the project?
-
-
-
- How will this project add value?
-
-
-
- What data do we possess? What is the format of these data?
-
-
-
- Regression or classification problem?
-
Step 2 : Data mining and processing
In his own, this step is composed by 3 level:
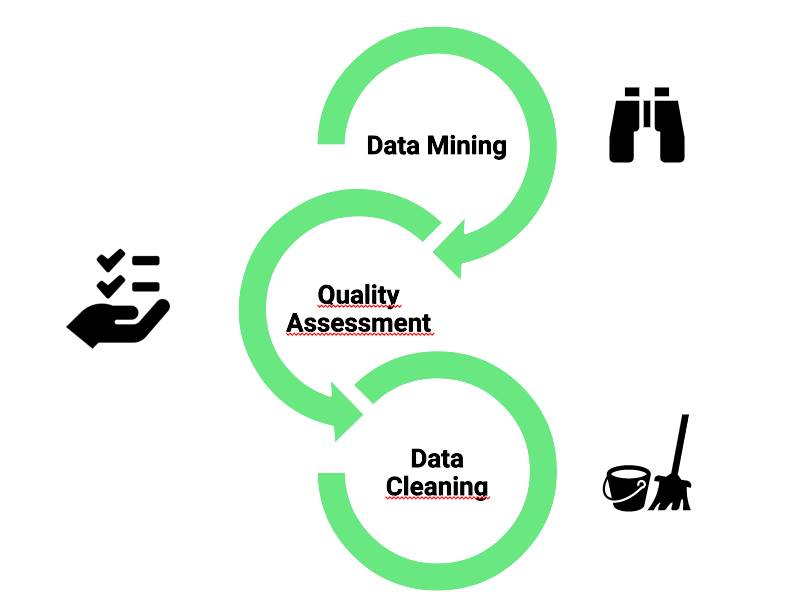
Data Mining:
The data mining process identifies and extracts the useful information defined in Step 1. You have first to identify data sources, in a second step you have to access the storage space and in a third time you have to retrieved relevant data.
Quality assessment:
Having the data is not all, it is necessary to check them and judge their reliability. In this aim, you have to determine which data are usable data, if there is any missing or corrupt value. And you have to check also the consistency of the data. In other word, this step help to check the veracity of the data that are given, to find if there is any error. You can check it thanks to statistical tools, like QQ plot.
Data cleaning:
Real world data is often noisy & presents quality issues. The quality assessment step provides a clear overview of the discrepancies in the data. The data cleaning process deal with this discrepancy. This step has the aim to correct quality flaws, transform the data and remove those which are fault.
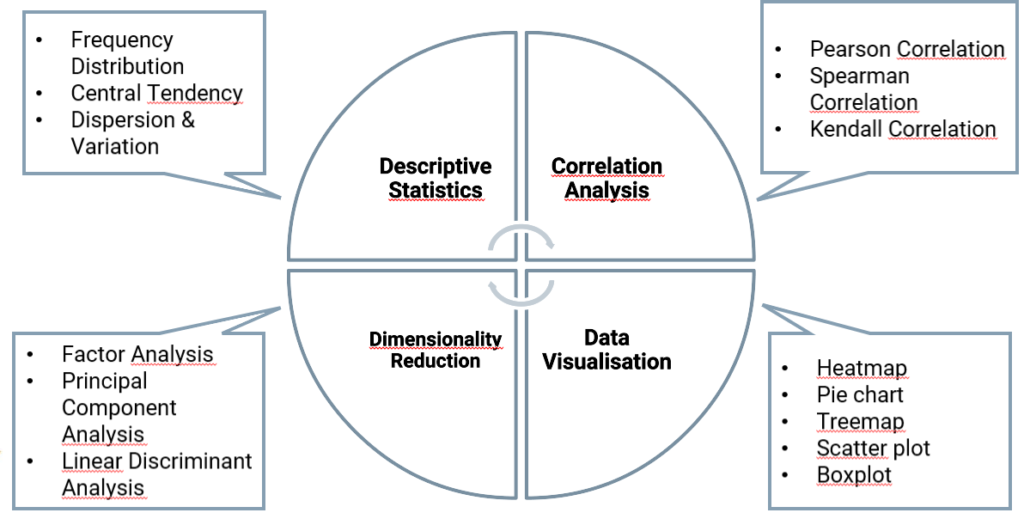
Step 3: Data exploration
Data exploration is the first step of the data analysis. The goal is to synthesize the main characteristics of these data. The purpose of this step isn’t to draw important conclusions, but to become familiar with the data, see general trends. It is also important for the detection of errors in the data. There is different pole in the data exploration: correlation analysis, descriptive statistics, data visualisation, dimensionality reduction. In each pole you can use different statistic tools as you can see in the diagram below.
Manual or automatic methods are used to make data exploration. Manual methods give analysts the opportunity to take a first look and become familiar with the dataset. Automatic methods, on the other hand, allow to reorganize and delete unusable data.
Data visualization tools are widely used in order to have a more global view of the dataset for a better understanding and to distinguish errors more easily. Moreover, to make this possible, the main programmatic tools used are the language R and Python. Indeed, their flexibility are highly appreciable by the data analysts.
Catch up the 3 lasts steps in our next article.
© Valkuren