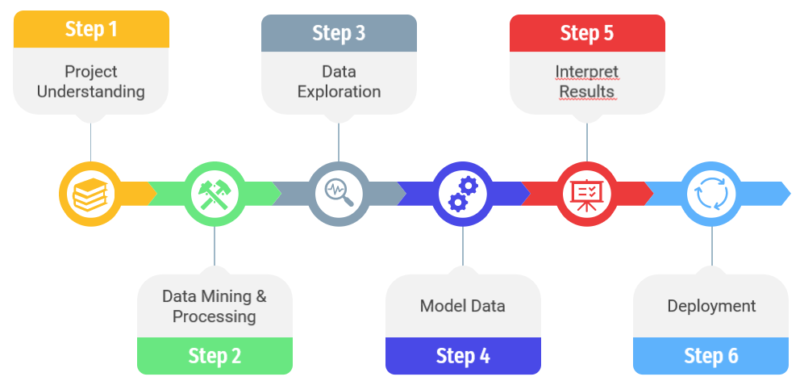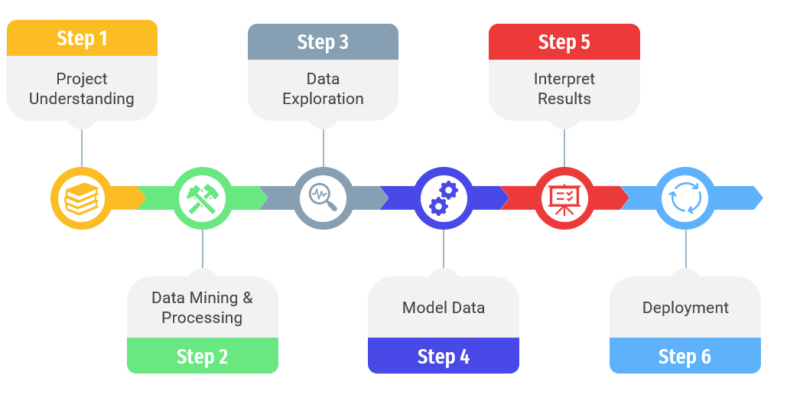
Step 4: Model Data
We could separate this “model data” step in 4 different steps:
-
-
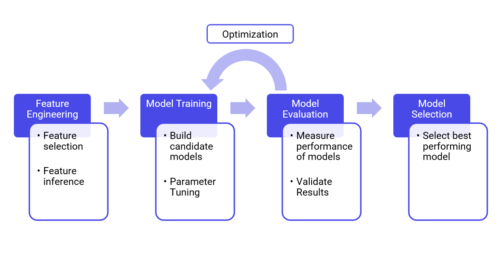
- The feature engineering is probably the most important step in the model creating process. The first thing to define is the term feature: are called feature the raw data as received by the learning model. The feature engineering is therefore, all the actions carried out on the raw data (clearing them, deleting null data, deleting aberrant data) before these data are taken into account by the algorithm, and thus the model. In summary, feature engineering is the extraction of raw data features that can be used to improve the performance of the machine learning algorithm
- The model training is the action of feeding the algorithms with datasets to start learning and improving them. The ability of machine learning models to handle large volumes of data can help manufacturers identify anomalies and test correlations while searching the entire data stream for models to develop candidate models.
- The model evaluation consists of assessing the created model through the output given by the model after having process data through the algorithm. The aim is to assess and validate the results given by the model. The model could be seen has a black box; you have the input that are given to the model algorithm (the dataset) in the model training and the output that are asses during the model evaluation. After having assess the results, you could optimize your model in the previous step.
- The model selection is the selection of the most performing and adapted model from the set of candidate model. This selection depends on the accuracy of the results given by the model.
-
Step 5: Interpret results
The main point about interpreting results is to represent and communicating results in a simple way. Indeed, after having process the previous step results could be heavy and hard to understand.
In order to make a good interpretation of your results, you have to go back to the first step of the data science life cycle that we have cover in our last article, to see if your results are related to the original purpose of the project and if they are any interest in addressing the basic problem. Another main point is to see if your results have sense. If they are and if you answer pertinently to the initial problematic, then you likely have come to a productive conclusion.
Step 6 : Deployment
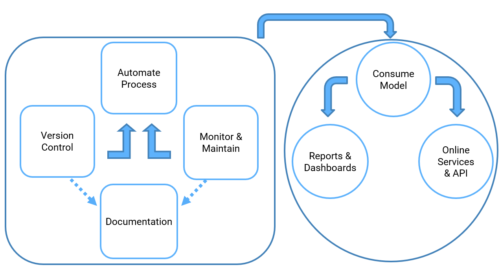
The deployment phase is the final phase of the project life cycle of a data science project. It consists in deploying the chosen model and applying new data to it. In other words, putting its predictions available to user or service system is known as deployment.
Although the purpose of the model is to increase understanding of the data, the knowledge gained will need to be organized and presented in a way that the client can use and understand it. Depending on the needs, the deployment phase may be as simple as producing a report or as complex as implementing a reproducible scientific data process.
By following these steps in your data science project process, you make better decisions for your business or government agency because your choices are backed by data that has been robustly collected and analysed. With practice, your data analysis gets faster and more accurate – meaning you make better, more informed decisions to run your organization most effectively.
© Valkuren

 Hey, I’m Brieuc, Sales & Business developper. At Valkuren, I can be accomplished in my work by combining my several points of interest in everyday business: Marketing, strategy, management and data.


 Hello everyone, I am Arthur and I am currently working as a Data Scientist at Valkuren. I am always enthusiastic to embark on a new data-driven journey, looking for some nice insights for your business!
  Hey I’m Uendi, Data Scientist at Valkuren. As a mathematics graduate, I’m happy to admit that science is my passion and talent. I often find myself exploring its applications in my life. At Valkuren, this passion of mine was re-established and I was reassured about my path in the shoes of a woman in science and technology. “Valkuren is the key to my personal and professional growth, the only way to do great work is to love what you do.”
  Data Scientist at Valkuren. I thoroughly enjoy problem solving and have a passion for data-driven decision making, keeping up to date with the latest tools and techniques. I have particular interests in methods such as conformal prediction, recommender systems. Thanks to a background in mathematics and computer science I help clients leverage their data into actionable insights.