
I – Background Information
To ensure the efficiency of their service and identify areas of improvement, a public transport operator was interested in analyzing the punctuality of their buses and building a streamlined Business Intelligence reporting system.
The client needed a simple and intuitive tool to gain insights into the quality of their operations with regards to their scheduling. Equally, they wished to monitor the services provided by third party operators. Due to the thousands of vehicles dispatched daily, and the volume of data subsequently generated, the previous approach proved to be tedious and overwhelming.
Additionally, in a bid to anticipate network issues and improve scheduling, the transport operator wished to identify the root causes of non-punctual buses. Forecasting delays for example may allow the client more flexibility and precision when designing bus timetables, ultimately improving customer satisfaction.
The goal of this project was therefore:
- Build operational dashboards for bus punctuality.
- Assess the quality of data collection process.
- Define a data modeling roadmap and lay foundations for automated punctuality predictions.
II – Approach
The first task was to collect the client’s internal data from various sources, clean them, and transform them into intelligible formats. We used feature engineering techniques to extract information regarding previous journeys for a given bus and to extract the status of the journey, whether it was on schedule or not. As we needed to assess the quality of the clocking system used in the buses, we also created a new parameter to flag any detected deviations or problems within the collected data.
Once the pre-processing work done, we centralized the data in a new database and created a new data model with the integration of external data such as geographical data and weather data.
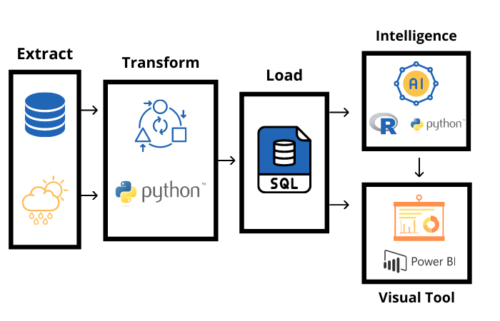
Through multiple discussions with the business stakeholders, we defined the needs, requirements and priorities to create operational reports and dashboards. We built multiple reports to track various KPI’s related to the punctuality of the buses. Most notably we built intuitive dashboards for tracking the punctuality of buses for departure and arrival, designing geographical maps for tracking the punctuality in different municipalities and regions, and to view the punctuality of third-party operators.
In parallel to the creation of operational reports, we performed the predictive analysis steps. The objective was to model the data and to predict if a given journey was likely to arrive late. We started by analyzing late journeys to identify trends with parameters such as the weather, the region, the bus route and the bus number. We used a wide-ranging list of tools such as descriptive statistics, inferential statistics and data visualization for this step. Next, we set up two prediction tasks:
- a classification task.
- a regression task.
For the classification task, we created three classes:
- Ahead of schedule.
- On schedule.
- Late.
For the regression task, the objective was simply to predict the time of arrival. For both tasks, we created predictive models using multiple machine learning algorithms and selected the best performing ones. A forward stepwise feature selection process was implemented to select the variables with the highest predictive impact on the models, this helps both in terms of running time and the interpretation of the algorithm. Given time restraints we setup a roadmap to improve, optimize and deploy the predictive models in an operational setting, and, as the quality of predictive models depends on the quality of the data, we provided recommendations to further enhance the data collection process.
III – Results
The new operational reports provide a centered, intuitive and simple reporting solution to visualize the punctuality for the client’s fleet of buses. This solution enables the transport operator to gain valuable insight in their continuous operations and act efficiently based on the reported information.
Additionally, with the help of the quality analysis on historical data, and the continuous quality assessment provided by Valkuren, the client can take the correct measures related to the collection process and continually monitor this process to detect any future problems.
As a result of the foundations established for predicting future bus punctuality, the defined roadmap to automate the predictive models and the transfer knowledge provided by Valkuren, the client has all the tools necessary to deploy the process to a production environment and integrate it in the decision-making process.
Lastly, there are many opportunities to scale the solution to further regional directorates within the company to increase consistency and uniformity across the board.